According to a recent survey, most IT leaders are in favor of a hybrid workplace model, but at the same time, 90% of employees are frustrated by workplace technology and its impact on their productivity.
Point Monitoring Tools Leave IT Teams Unprepared
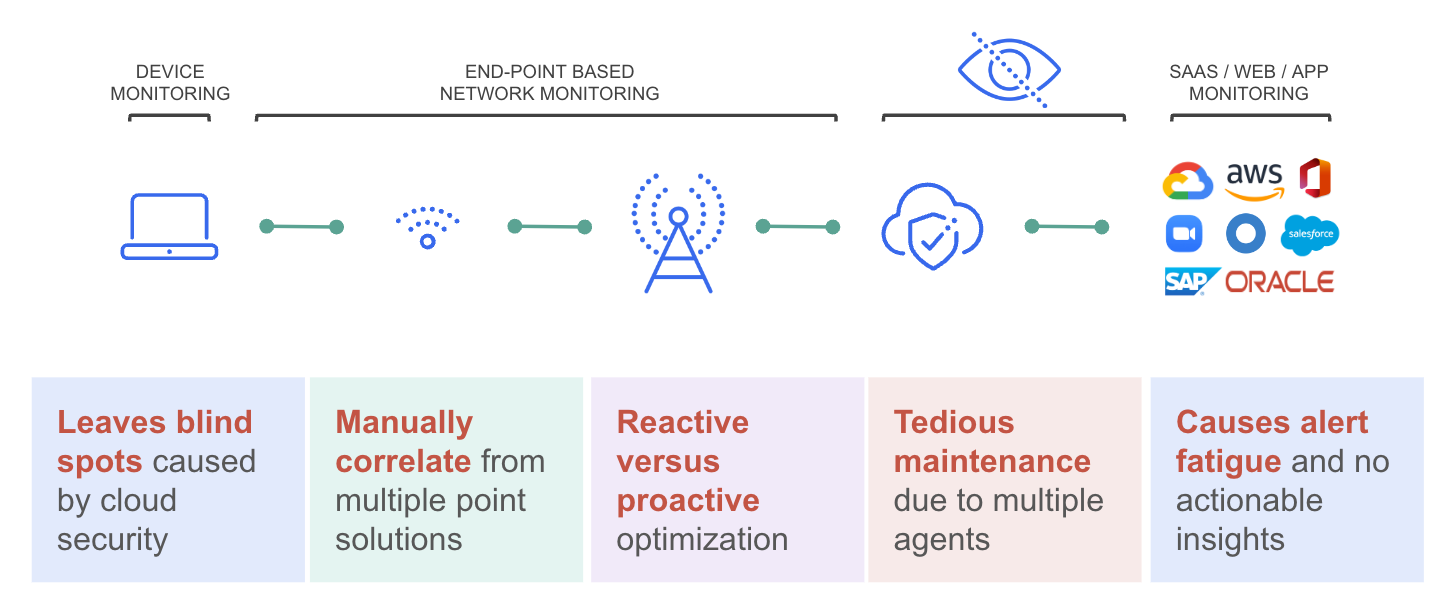
Making matters worse, Network Operations and Service Desk teams are forced to rely on point solutions that leave them unprepared. Device, network, and application monitoring tools only see fragments of the application delivery chain, leaving blind spots between the user’s device and the app that require teams to manually export and correlate data from each tool. This lack of end-to-end visibility into digital experience forces IT teams to firefight problems after they have been reported, rather than proactively identifying and resolving them before users are impacted.
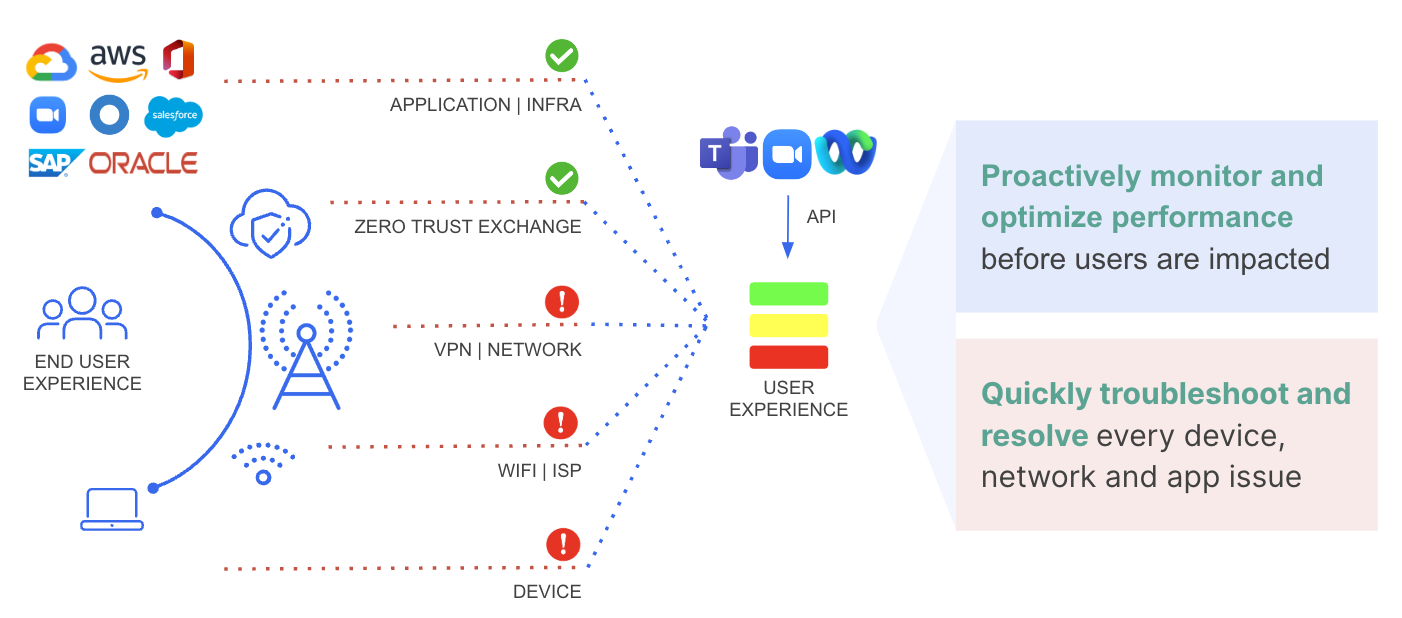
Zscaler Digital Experience (ZDX) gives you the visibility you need to ensure optimal digital experiences for all your users—in the office, at home, and on the move. By securely monitoring your business’s SaaS-, public cloud-, and data center-based applications right from within your end user devices, ZDX can present user experience insights across your organization, along with an end-to-end view of performance and availability across the entire application delivery chain.
Armed with these insights:
- Network Operations teams can review digital experience health and root causes of bottlenecks across all enterprise applications in real time as well as rapidly resolve service degradation before users complain.
- Service Desk teams get what they need to troubleshoot complaints—a wealth of information including device health, active processes and events, network performance from the user’s Wi-Fi and ISP and through the Zscaler Zero Trust Exchange, and application performance and availability metrics.
No other digital experience monitoring solution provides a unified view of performance from the device, through the network and the Zero Trust Exchange, and up to the SaaS-, cloud-, or data center-based application, along with root cause analysis that exposes issues impacting user experience.
NEW: Faster IT Resolutions with AI-Powered Root Cause Analysis and Troubleshooting
When ZDX detects anomalies or poor user experience, it can automatically create ServiceNow tickets that present service desk analysts with multiple insights into device, network, application, and more.
AI-Powered Root Cause Analysis
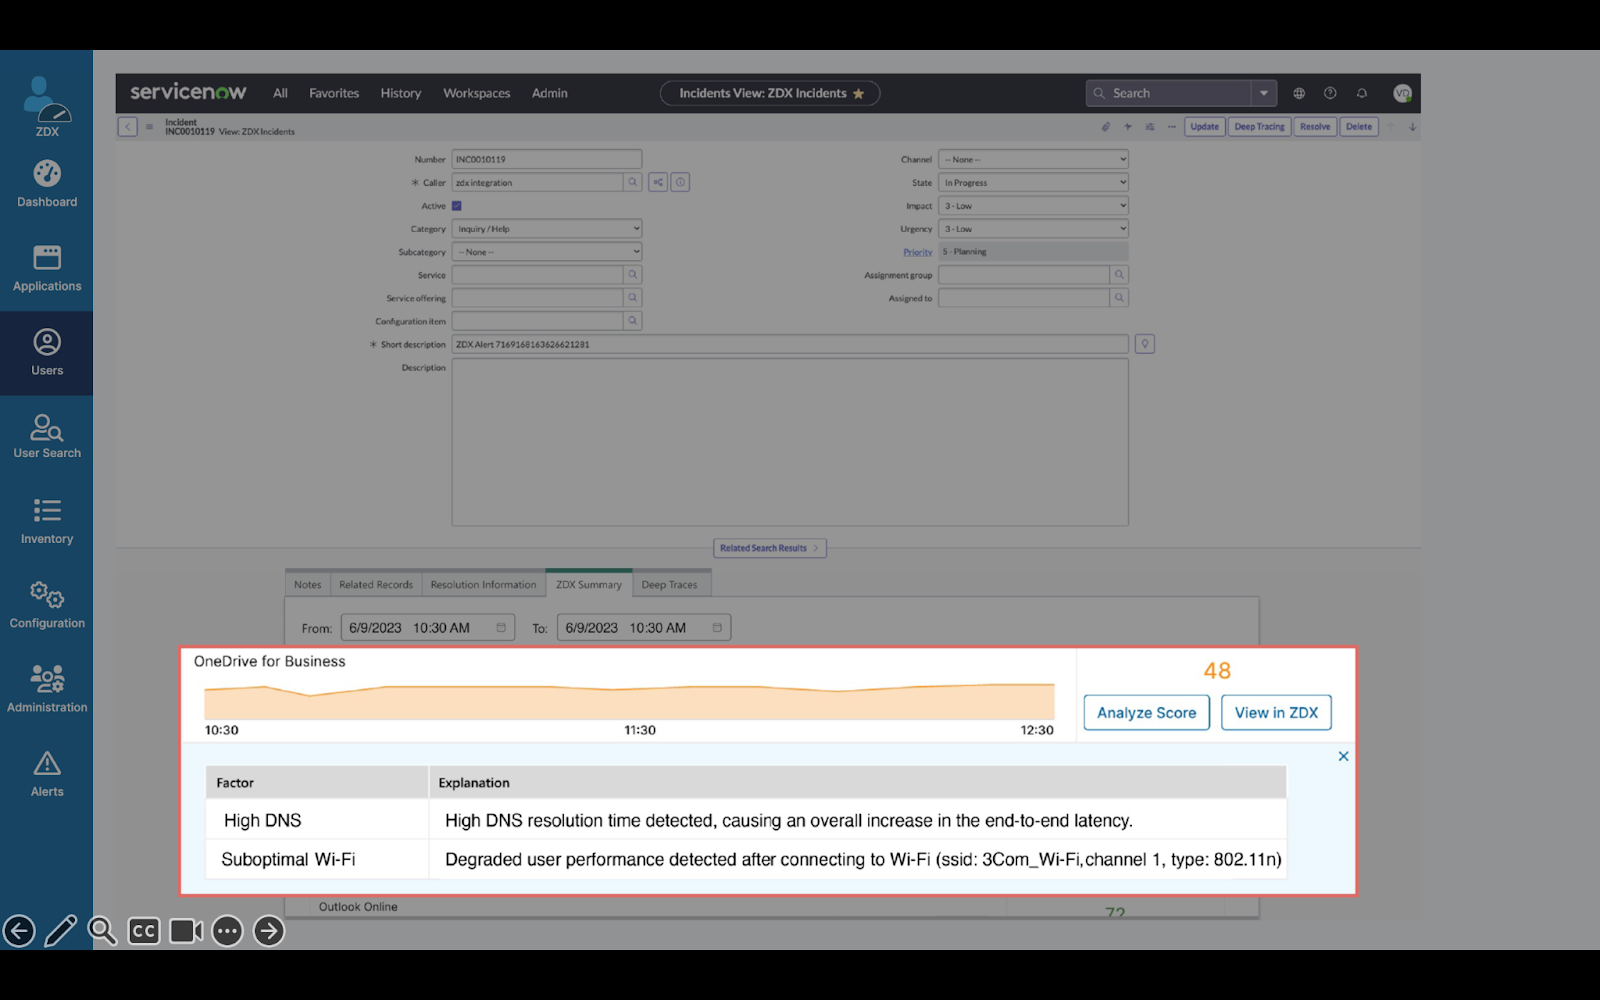
To help service desk analysts expedite triage and resolution, ZDX includes the root cause of a reported problem as determined by AI and ML. The figure below shows the integration of AI-powered root cause analysis with ServiceNow, with the top contributing factors shown directly in ServiceNow. In this example, an analyst could easily see that the top factor is high DNS latency, and then escalate the ticket to a network specialist.
AI-Assisted Troubleshooting
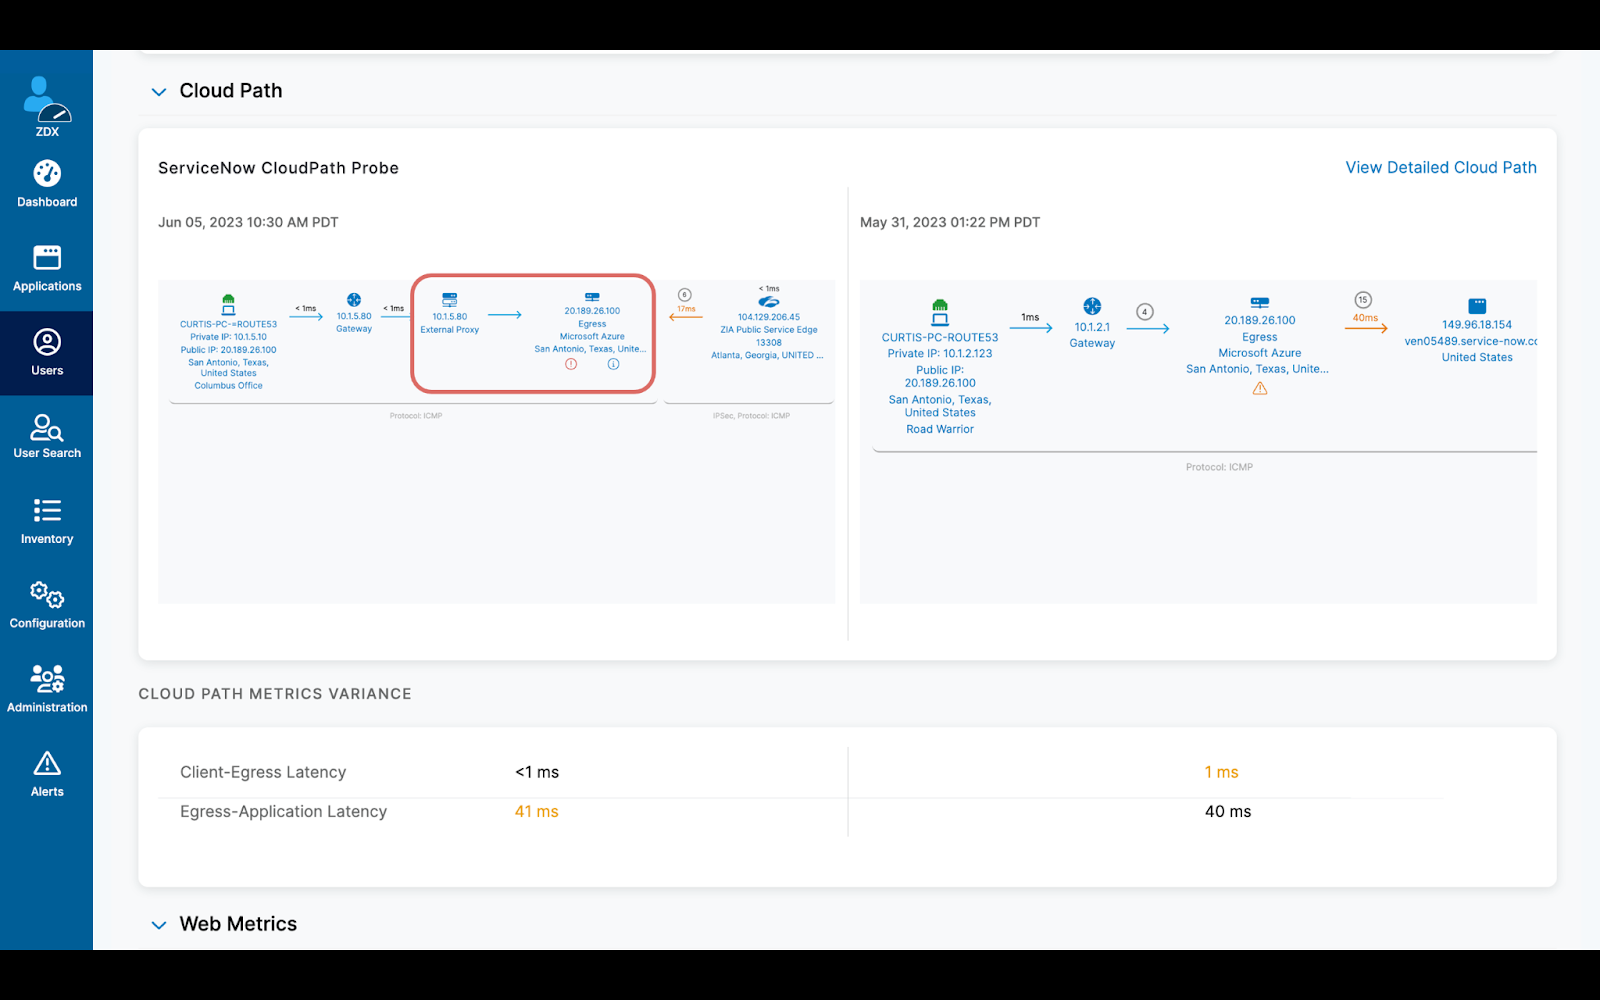
For the network team to continue with analysis, service desk analysts can simply create a ZDX Snapshot so that network specialists can review the incident.
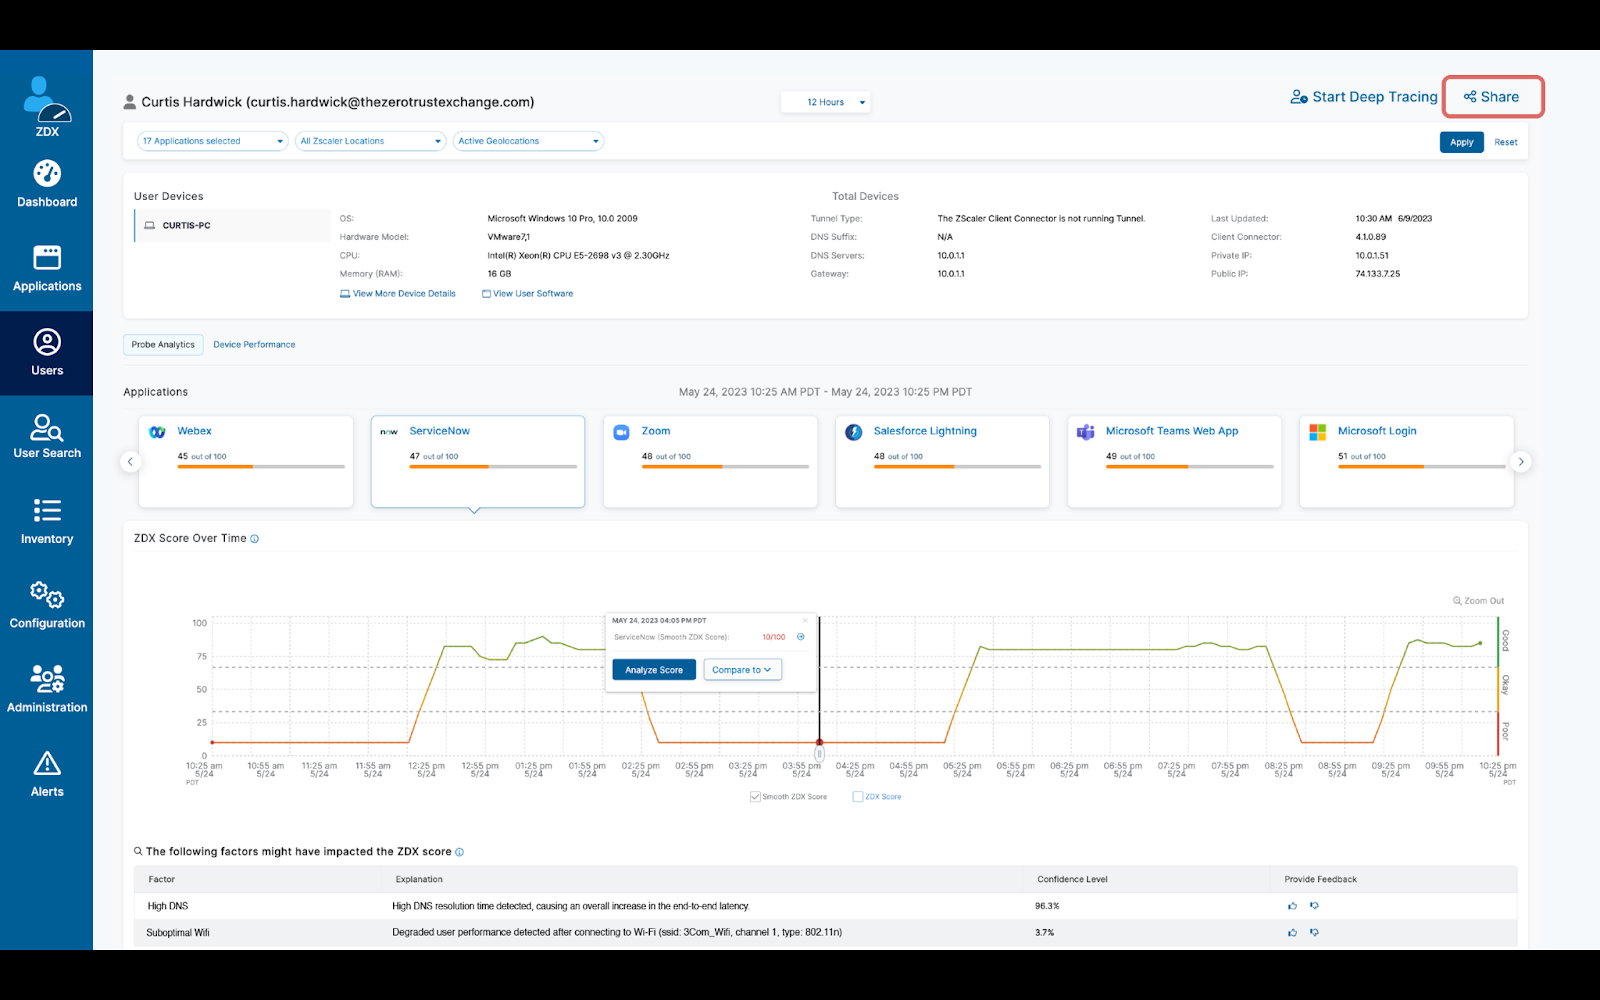
From within the snapshot, network specialists can dig deeper. Using the “compare” function, they can review what factors have changed since the last time the user experience was good. This side-by-side comparison view offers a quick understanding of the right focus areas to implement lasting resolutions. In this example, there is a service chain between a third-party proxy and the Zero Trust Exchange, so the DNS configuration needs to be checked.
NEW: Reduce Ticket Volume by Empowering End Users to Fix Problems
We have introduced self-help capabilities designed to tackle work-from-home or Starbucks moments, aiming to put an end to an old problem: “I don’t want to troubleshoot the user’s home network, nor do I have the tools to do so.”
ZDX now empowers end users to fix problems that impact their digital experience, if a fix is under their control. A lightweight AI engine running in Zscaler Client Connector notifies users of issues like poor Wi-Fi or high resource utilization, and then offers suggestions on how users can resolve those issues themselves.


The result is a pair of benefits: end users can restore their own productivity faster without creating support tickets, and Service Desk teams have lower ticket volumes to address.
NEW: Proactive Problem Resolution Using Incident Dashboard
Customers have told us they want to know the big picture—big problems that affect multiple users. The most common issues in the past few years have been related to ISP and Wi-Fi connectivity.

The new ZDX Incident Dashboard includes new ML models to detect problems in applications, Wi-Fi, Zscaler data centers, last mile and intermediate ISP, and the endpoint, with automated AI-powered correlation.

The dashboard includes incidents that have occurred in the last two weeks, with details on who was impacted, when, and where.
Analyzing Wi-Fi Incidents
Let’s look at Wi-Fi incidents that have occurred across all locations worldwide.

You can drill down into the incident details page to further understand the area of impact, epicenter, who is affected, and where. In addition, you can categorize the list of affected users for additional pivots as “trust but verify.” This is due to the fact that, ZDX, by design incorporates explainable AI to understand root cause.
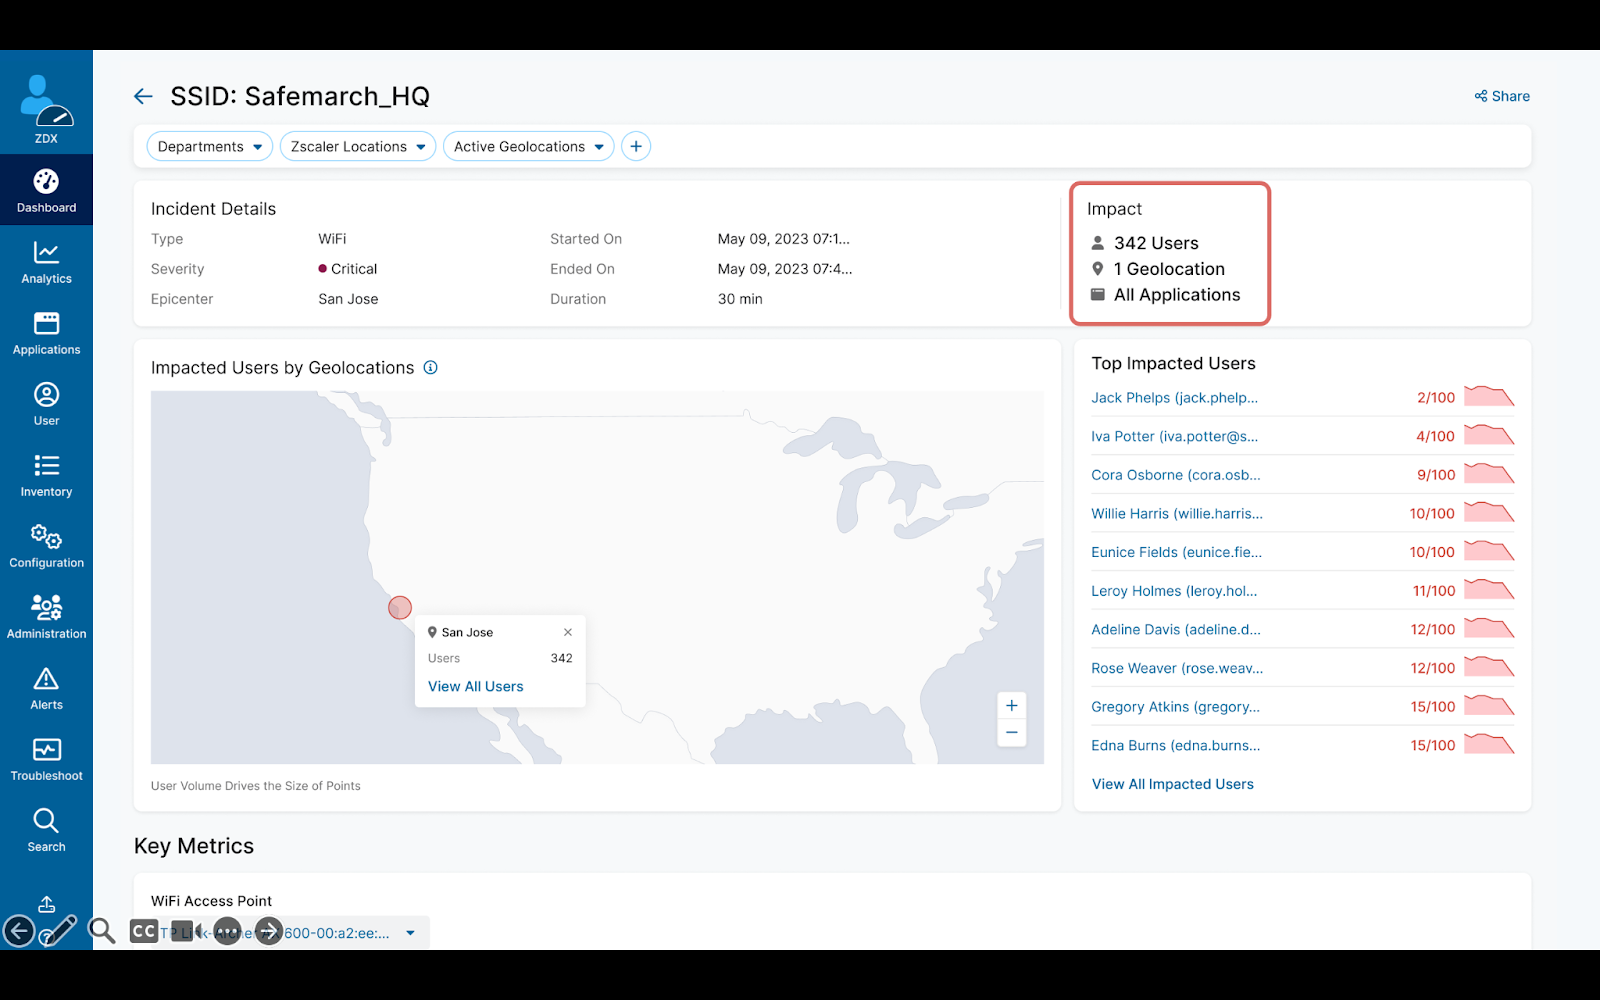
Every incident incorporates the most relevant metrics to understand what triggers the incident. For Wi-Fi incidents like the one above, metrics include access point latency, packet loss, jitter that carries over, signal strength, bandwidth, and channel usage.
Analyzing the Impact of ISPs on Digital Experience
In the hybrid workplace, where the internet is the corporate network, every home network, every branch, and every location becomes a source of possible network problems. How can you manage the unmanageable?
We have introduced two incident classifications, Last Mile ISP and Intermediate ISP, to detect ISP related glitches and quickly surface when the ISP is affecting performance, including blackouts or brownouts. This allows Network Operations teams to rule out every other possible root cause and focus on restoring reliable connectivity as soon as possible.
ZDX looks holistically across billions of signals collected from billions of probes, alongside petabytes of telemetry data, to understand the root cause and pinpoint problem areas. This approach benefits all customers, even those with only a small deployment of ZDX.
In this next example, let’s look at a Last Mile ISP incident.
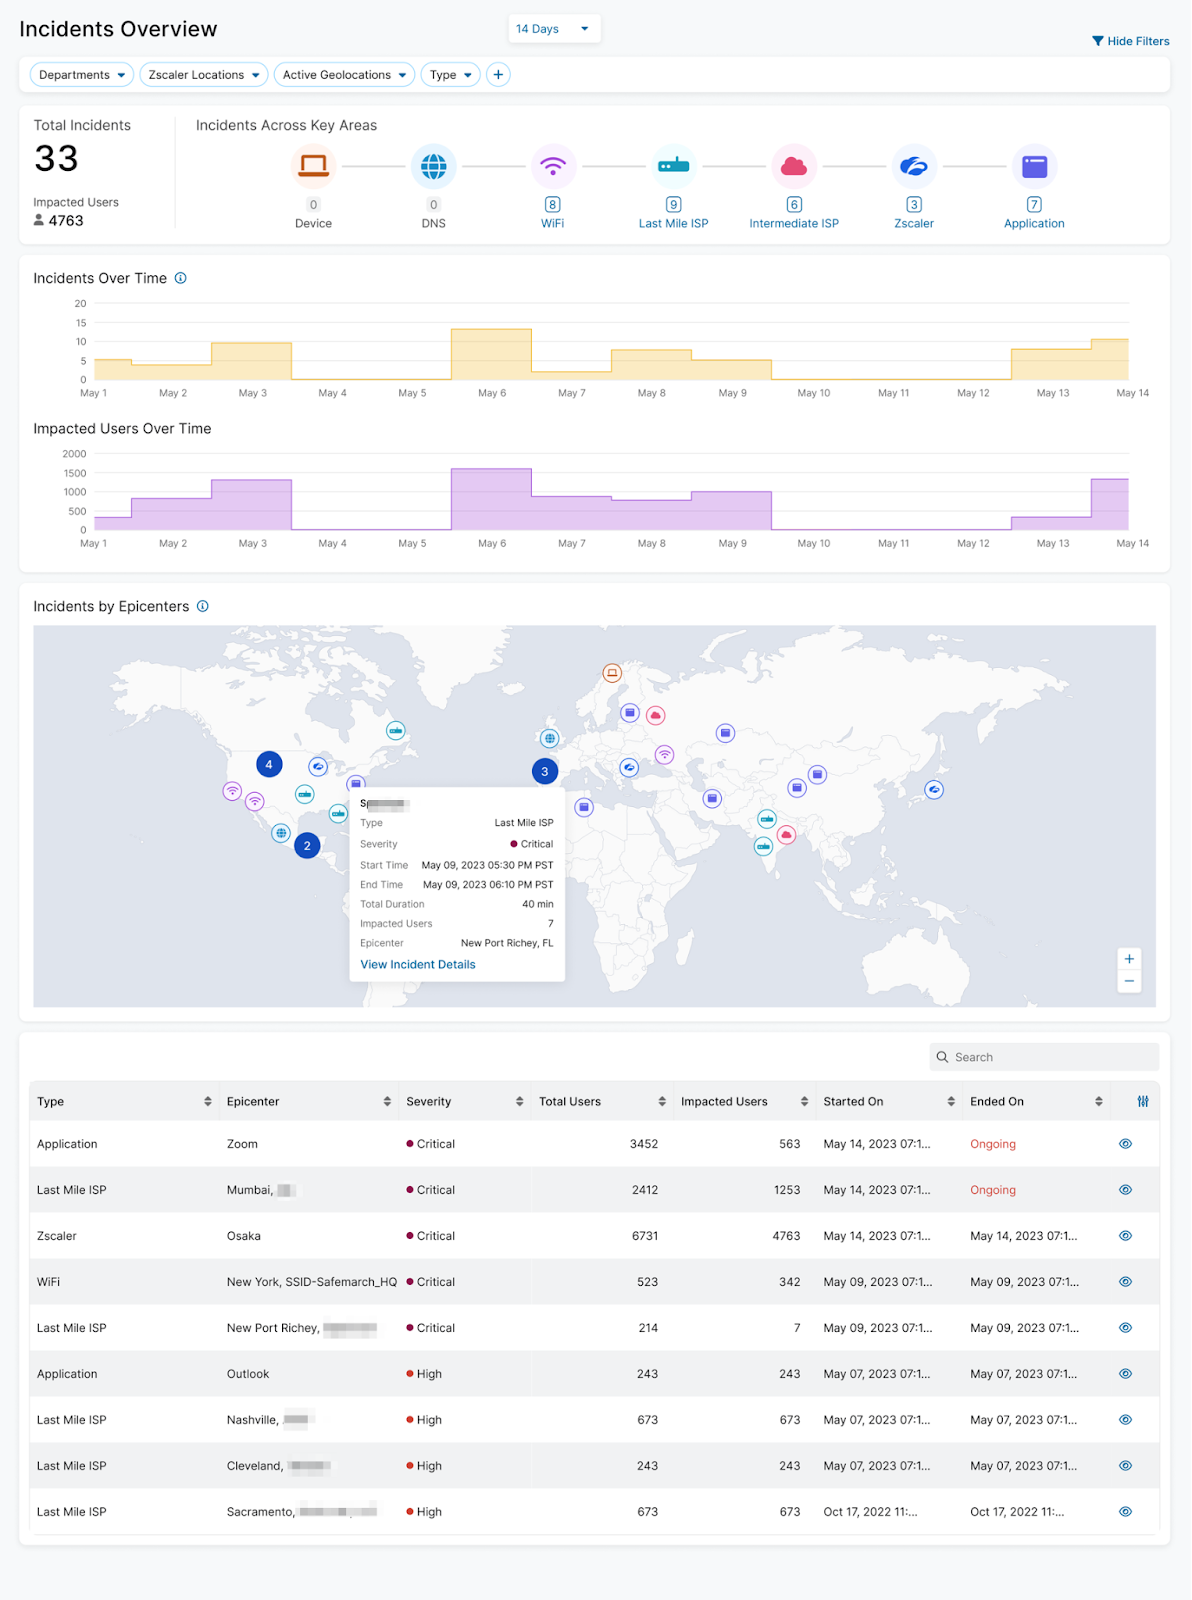
Drilling down in the Incident details page, you can see the impacted users, the drop in score, and some key metrics. The most important metric is the latency observed during the first internet hop.

If We Don’t Own the ISP, Why Is It Important to Detect Problems There?
Users will complain about performance problems. Being able to communicate exactly where a problem is avoids unnecessary troubleshooting time, even if the source of the problem is outside your control.
Customers with multiple egress points to the internet can change BGP settings to switch ISPs, avoiding one with a brownout or blackout. When the problem is on the core ISP of the internet, Zscaler cloud operations will work to overcome it, either rerouting the traffic or switching the customer-serving data center to one not experiencing the impact of the faulty ISP.
ZDX is the most intelligent DEM in the market, designed to help Network Operations and Service Desk teams ensure flawless digital experiences and employee productivity. From inception, we designed ZDX to simplify detection and troubleshooting by quickly understanding the source of problems, providing deep metrics and AI/ML support to enable teams to find the needle in the haystack.
With ZDX, you can:
- Unify your monitoring toolset and insights into a single pane of glass to help multiple teams—device, network, security, and application teams—ensure optimal performance
- Empower end users to learn about and fix problems within their control, reducing ticket volume
- Detect developing incidents early and proactively resolve them using AI-powered correlation and insights
Learn more about the ZDX and how you can use it in your organization: Request a demo!


