Zscaler Blog
Erhalten Sie die neuesten Zscaler Blog-Updates in Ihrem Posteingang
Abonnieren
Anpassung an hybride Arbeit: Optimierte digitale Erfahrungen durch Erfassen der richtigen Daten an den richtigen Orten
Seitdem immer mehr Personen hybrid arbeiten, sind schlechte Anwendererfahrungen leider zur Normalität geworden. Beschwerden über langsame Anwendungen, Netzwerkausfälle und Computerabstürze sind heutzutage an der Tagesordnung. Die meisten Probleme treten jedoch nicht permanent auf und gelten deshalb auch dann als gelöst, wenn die eigentliche Ursache nie gefunden wird.
Für eine Ursachenanalyse benötigt man viele Daten, die zeitlich geordnet, kontextbezogen und so umfassend sein müssen, dass man potenzielle Ursachen identifizieren (oder ausschließen) kann. Das Problem ist, dass diese Daten mit herkömmlichen Monitoring-Methoden nicht einfach erfasst und analysiert werden können. Darüber hinaus wirken sich Performanceprobleme auf User und Anwendungen aus, die sich überall befinden können, was die Erfassung der richtigen Daten an den richtigen Orten noch erschwert.
Bei meiner früheren Tätigkeit als Gartner-Analyst bestand die größte Herausforderung für meine Kunden nicht darin, dass sie zu wenige Performancedaten erfassten. Schwierig war eher, mehrere Silos mit unkorrelierten Performancedaten zu nutzen, um ein Problem tatsächlich zu beheben. Isolierte Monitoring-Tools, die sich auf nur einen Bereich konzentrieren, wurden verwendet, um die Schuld von einem Team auf ein anderes zu schieben. Beispielsweise machte das Anwendungsteam das Netzwerkteam verantwortlich, welches wiederum der Abteilung Sicherheit oder Enduser-Computing die Schuld gab. Wenn denn überhaupt solche Tools vorhanden waren. In einigen Kundenumgebungen gab es gar keine Transparenz.
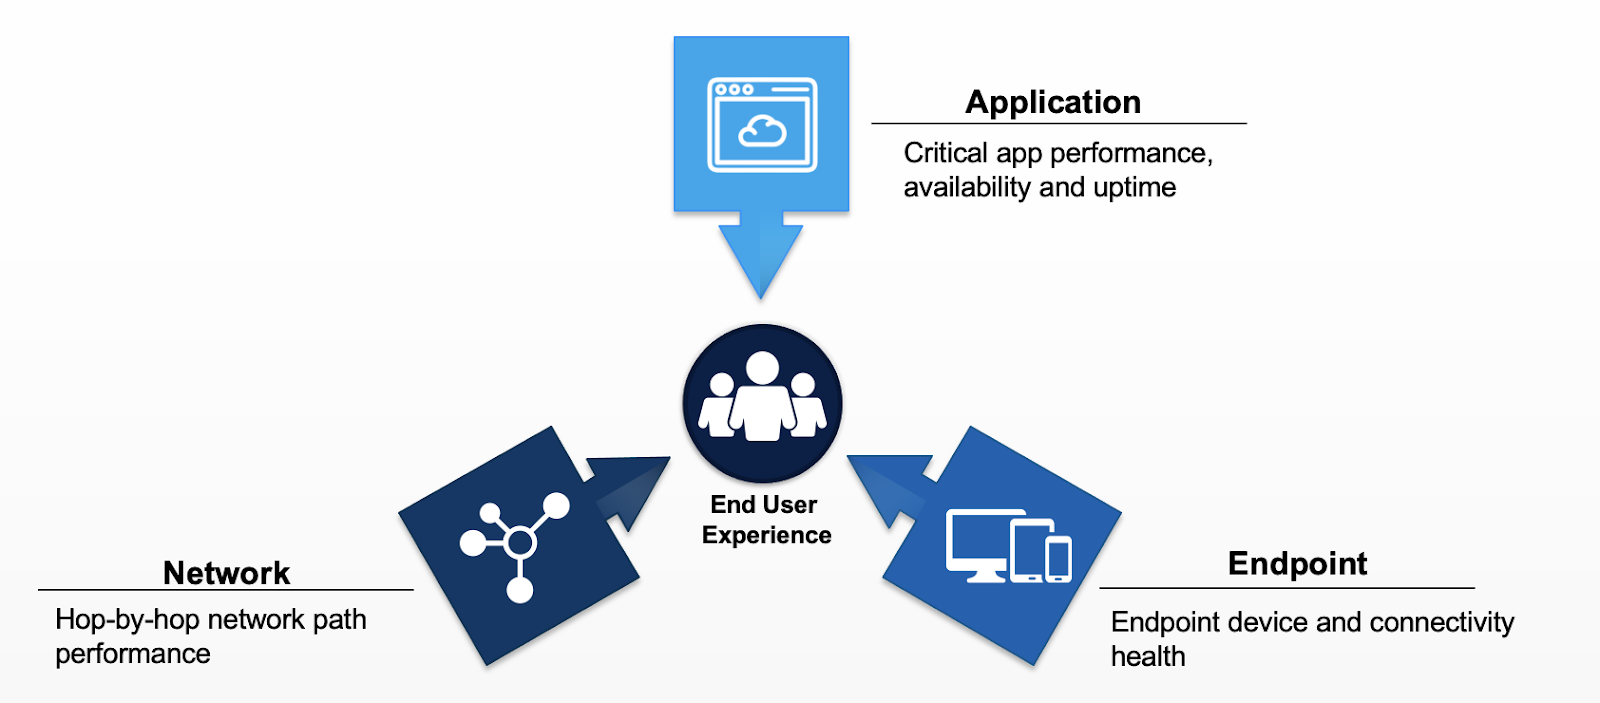
Abbildung 1: Für Digital Experience Monitoring müssen telemetrische Performancedaten erfasst, korreliert und visualisiert werden, um verwertbare Erkenntnisse für alle User zu erhalten.
Bei jeder umfassenden Diagnose werden sowohl Zeitreihen- als auch Ereignisdaten aus drei Hauptbereichen potenzieller Ursachen erfasst: Anwendung, Netzwerk und Endgerät. Mithilfe dieses Ansatzes können genug Hinweise gesammelt werden, um das Problem zu identifizieren und zu lösen.
Bekanntermaßen können Daten unübersichtlich sein und es gibt selten eindeutige Beweise für Probleme. Beispielsweise kann eine schlechte Anrufqualität in Microsoft Teams oder eine langsame Anwendung verschiedene Ursachen haben. DEM-Lösungen (Digital Experience Monitoring) wurden entwickelt, um genau dieses Problem zu beheben. Sie müssen aber echte Anwendererfahrungen erfassen und auch alle potenziellen Auslöser wie z. B. Endgerät, Netzwerk, Anwendung und Sicherheit scannen, um die zugrundeliegende Ursache zu finden.
Wie in Abbildung 2 zu sehen, ist es von entscheidender Bedeutung, mit einem objektiven Messwert für die Anwendererfahrung zu beginnen (hohe Seitenladezeiten, schlechte Anrufqualität). Dann geht es darum, die schlechte Anwendererfahrung mit den verschiedenen potenziellen Ursachen in Verbindung zu bringen.
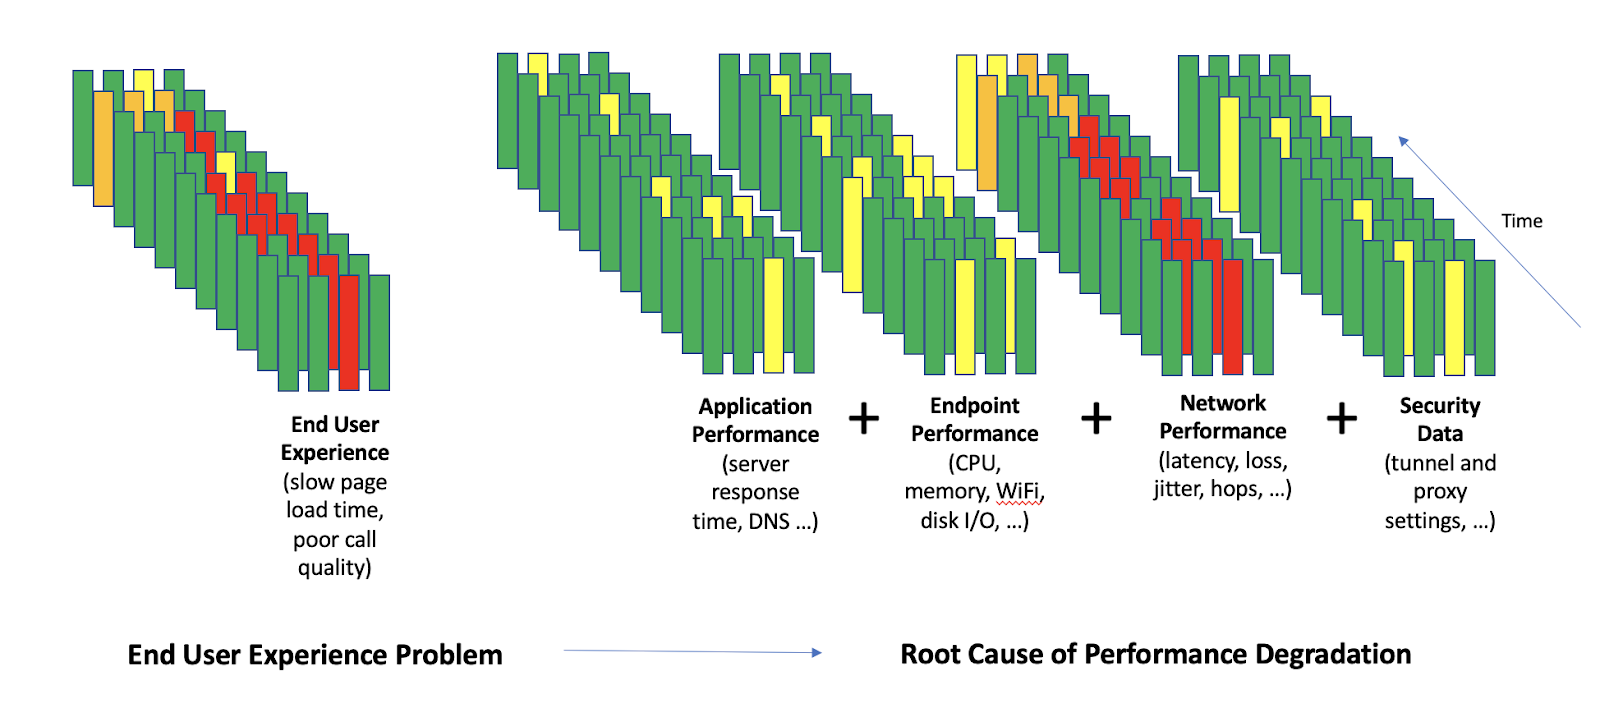
Abbildung 2: Für die Ursachenanalyse benötigt man eine Vielzahl von Datenpunkten, um die tatsächliche Ursache identifizieren und Nebensächliches ausschließen zu können.
Ein Zscaler-Mitarbeiter bemerkte beispielsweise vor einigen Wochen plötzlich, dass sich die Performance aller Anwendungen – aber vor allem die von Zoom – erheblich verschlechtert hatte. Da Zoom eine Echtzeitanwendung ist, machen sich Schwankungen in der Konnektivität besonders bemerkbar. Bei der Untersuchung in ZDX wurde ein Problem mit Zoom identifiziert: Der entsprechende ZDX-Score war gesunken und im Laufe des Tages kam es zu mehreren Performancerückgängen.

Abbildung 3: Performancerückgänge bei Zoom
Der erste Schritt bestand darin, sich die Server- und DNS-Auflösungszeiten anzusehen, um herauszufinden, ob die Performancerückgänge damit zusammenhängen. Hier lag das Problem nicht.
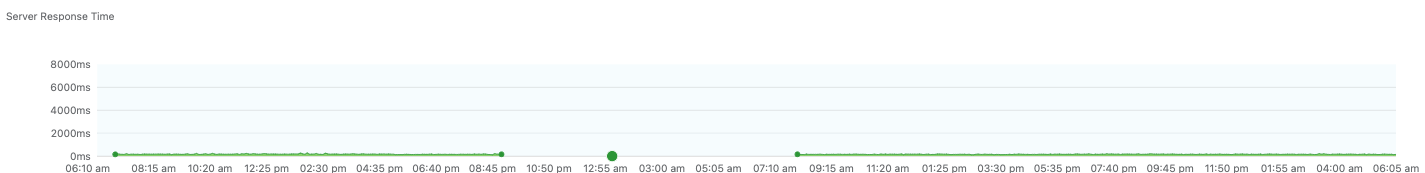

Abbildung 4: Server- und DNS-Antwortzeiten waren unverändert.
Der nächste Schritt bestand darin, die End-to-End-Latenz des Netzwerks zu untersuchen. Diese war zwar etwas sprunghaft, aber die Gesamtlatenz lag unter 25 ms und war somit wahrscheinlich nicht die Ursache des Problems.

Abbildung 5: Die Latenz war relativ unverändert und lag dauerhaft unter 25 ms.
Schließlich war es an der Zeit, sich mit dem Endgerät selbst zu befassen. Die Metriken für den Systemzustand des Geräts sahen gut aus, CPU-, Speicher- und Festplattennutzung waren in Ordnung.
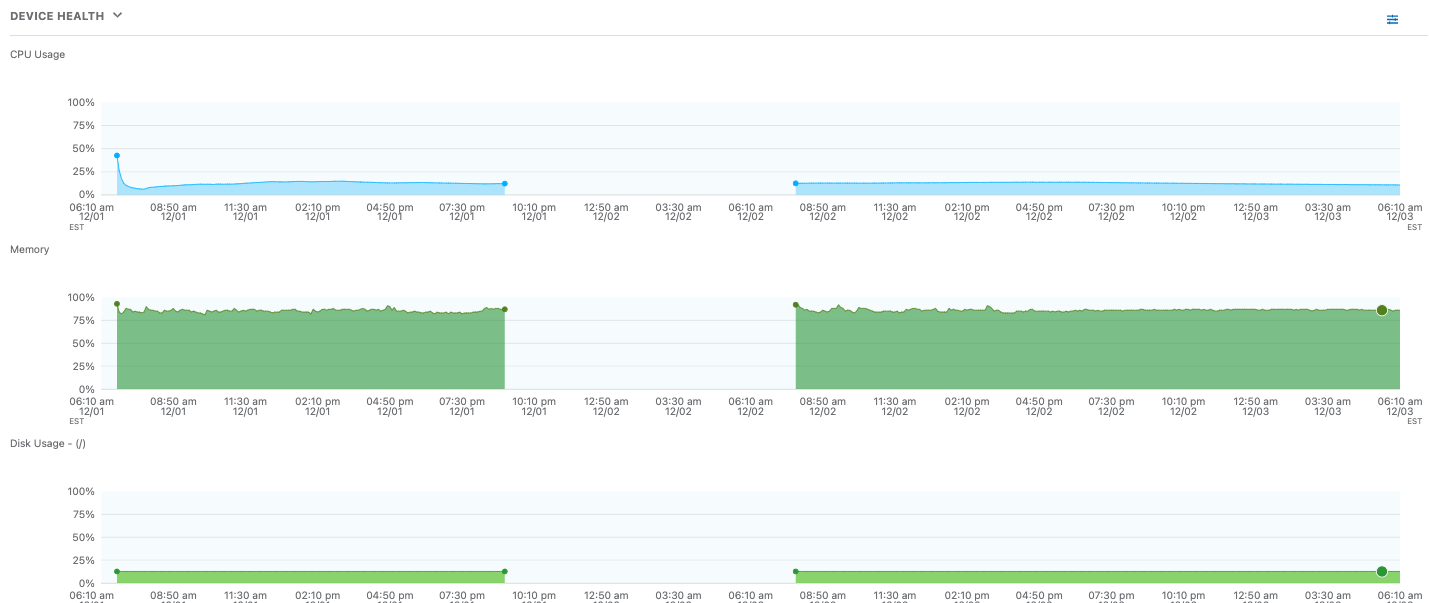
Abbildung 6: Der Gerätezustand war hinsichtlich CPU-, Speicher- und Festplattennutzung in Ordnung.
Die Gerätemetriken sahen zwar gut aus, aber in den Ereignissen wurden Änderungen an den Attributen des Endgeräts angezeigt. Die Gateway-MAC-Adresse wechselte zwischen einem gültigen Wert und einem Nullwert hin und her – ein Nullwert bedeutet, dass das Gerät die Verbindung beim nächsten Hop vorübergehend verliert. Da diese Ereignisse auf ein Layer-2-Problem zwischen dem Endgerät und dem Gateway hinwiesen, startete der User sein Gateway neu, doch das Problem bestand weiterhin. Schließlich tauschte er sein Gateway-Gerät aus, wodurch das Problem behoben wurde.

Abbildung 7: In den Geräteereignissen werden Änderungen an den Geräteattributen angezeigt. Daraus ergibt sich ein Layer-2-Problem zwischen Endgerät und Gateway.
Wenn es darum geht, die Ursache von Performanceproblemen zu finden, muss man die richtigen Daten an den richtigen Orten haben.
(Abbildung 2 ist inspiriert von der Arbeit des Gartner-Analysten Greg Murray. Diese kann hier aufgerufen werden – ein Gartner-Abonnement ist erforderlich.)

War dieser Beitrag nützlich?
Haftungsausschluss: Dieser Blog-Beitrag wurde von Zscaler ausschließlich zu Informationszwecken erstellt und wird ohne jegliche Garantie für Richtigkeit, Vollständigkeit oder Zuverlässigkeit zur Verfügung gestellt. Zscaler übernimmt keine Verantwortung für etwaige Fehler oder Auslassungen oder für Handlungen, die auf der Grundlage der bereitgestellten Informationen vorgenommen werden. Alle in diesem Blog-Beitrag verlinkten Websites oder Ressourcen Dritter werden nur zu Ihrer Information zur Verfügung gestellt, und Zscaler ist nicht für deren Inhalte oder Datenschutzmaßnahmen verantwortlich. Alle Inhalte können ohne vorherige Ankündigung geändert werden. Mit dem Zugriff auf diesen Blog-Beitrag erklären Sie sich mit diesen Bedingungen einverstanden und nehmen zur Kenntnis, dass es in Ihrer Verantwortung liegt, die Informationen zu überprüfen und in einer Ihren Bedürfnissen angemessenen Weise zu nutzen.
Weitere Zscaler-Blogs erkunden

Introduction: OTZ Use Cases | Zscaler Zero Trust Exchange

Microsoft Outlook Outage Detected by Zscaler Digital Experience (ZDX)

Zscaler Digital Experience (ZDX) erkennt Microsoft Azure-Ausfall

Willkommen im hybriden Büro – dem Ort, vor dem IT-Teams sich fürchten
Erhalten Sie die neuesten Zscaler Blog-Updates in Ihrem Posteingang
Mit dem Absenden des Formulars stimmen Sie unserer Datenschutzrichtlinie zu.